The Confident Wrong Answer to Unity Mesh Memory: It's Static Batching, Not Read/Write

Open Unity’s official 3D Game Kit sample (Built-in pipeline), load Level1, make a Windows build, and take a Memory Profiler snapshot. One category dominates:
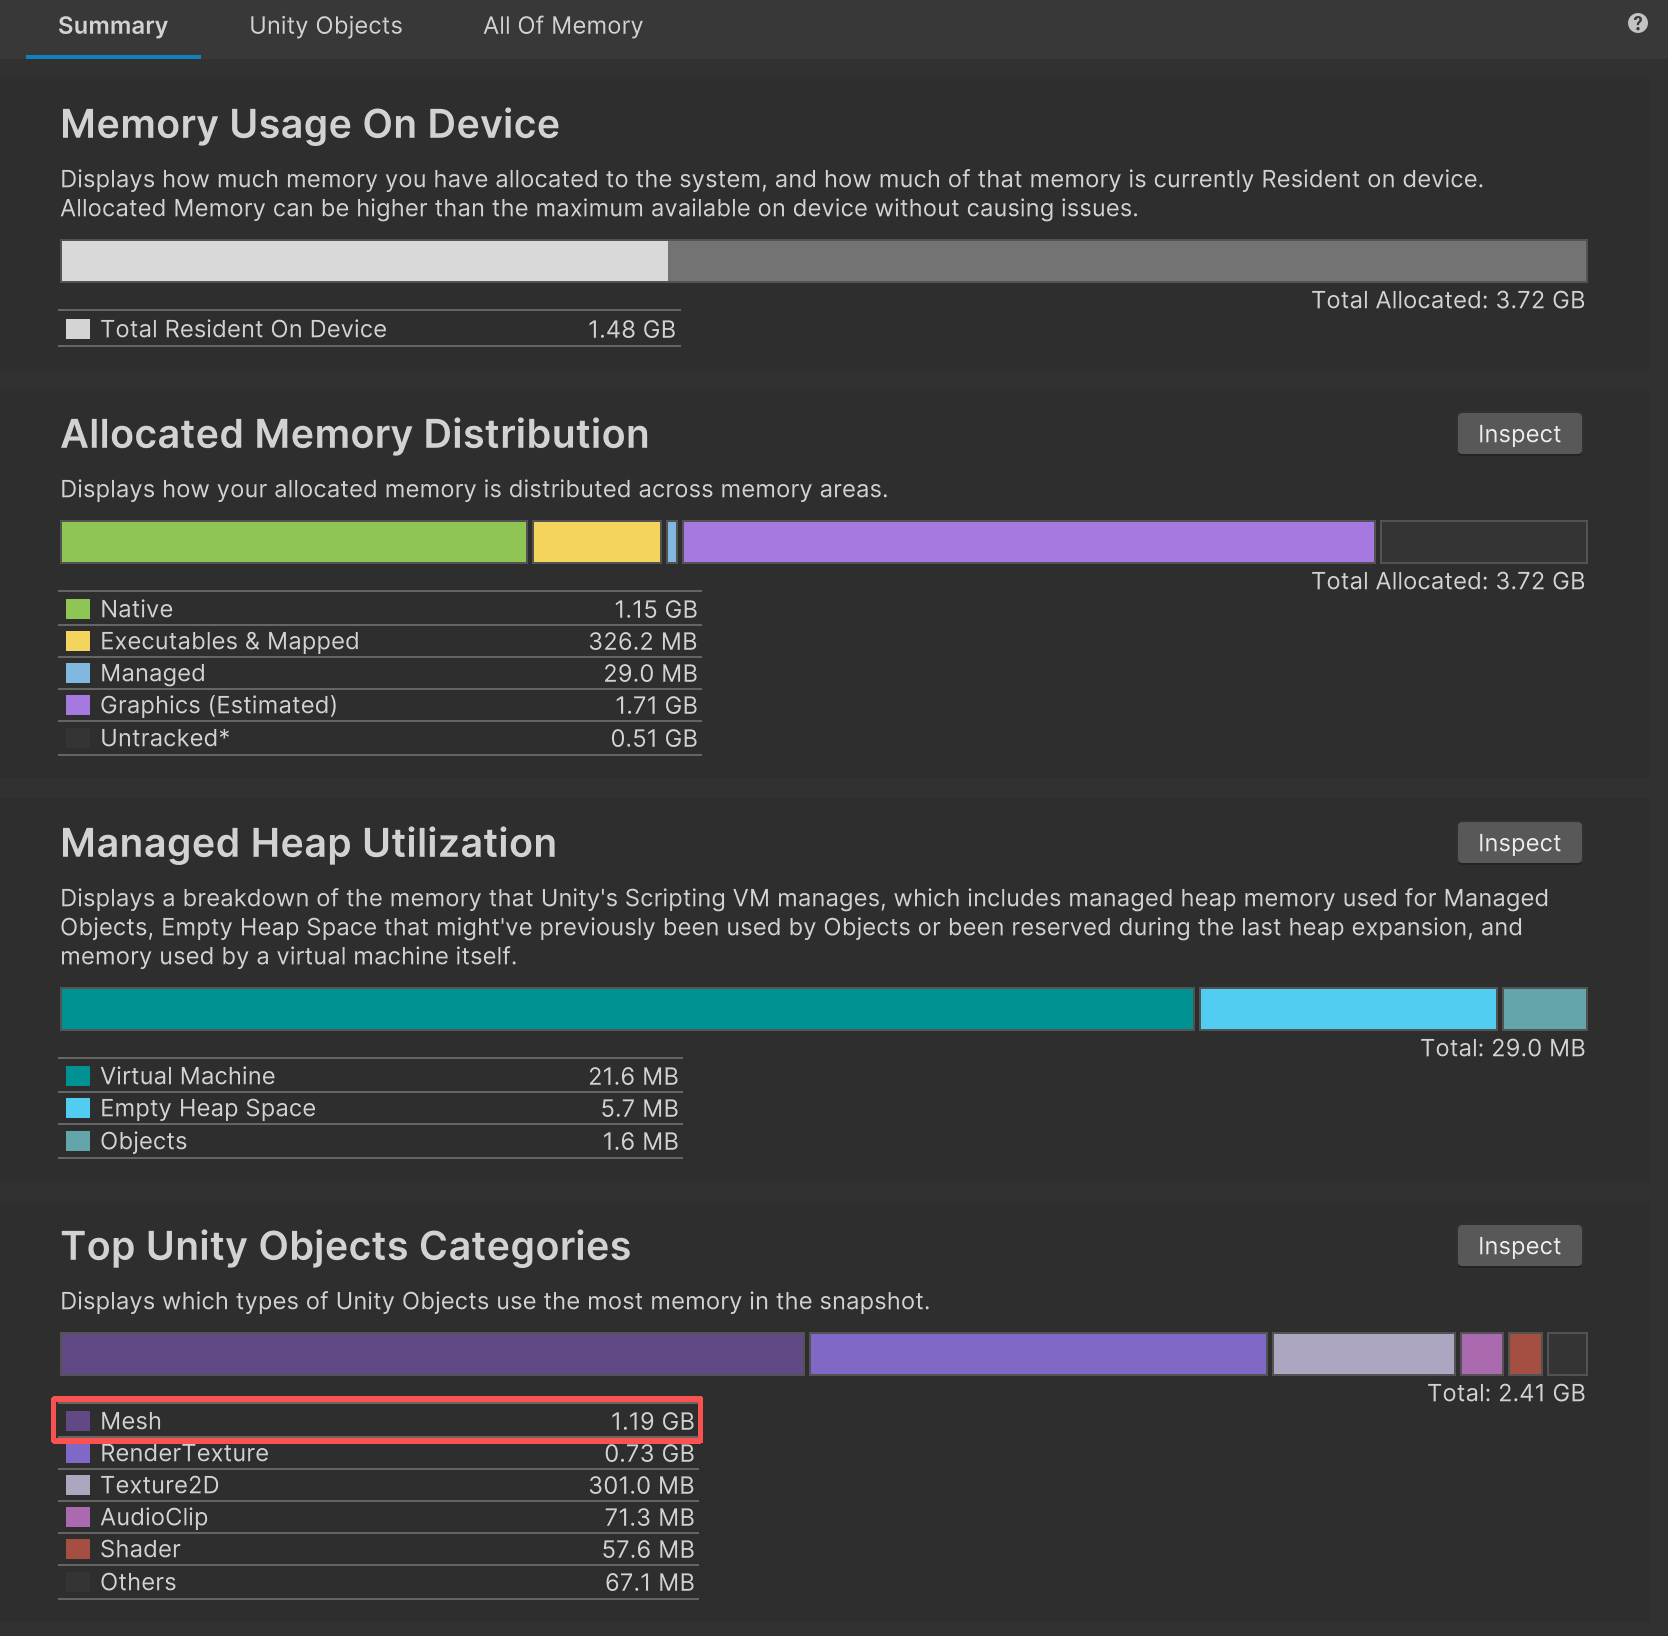
Mesh: 1.19 GB. Bigger than every texture and render target combined. So you ask the obvious question — why are my meshes eating a gigabyte? — and you get the obvious answer.
The textbook answer
Ask an LLM. Search the forums. Ask us, honestly — it’s the first thing we reached for too:
Read/Write Enabled. When it’s on, Unity keeps a CPU-side copy of the mesh in addition to the GPU copy, roughly doubling its footprint. Turn it off unless you modify mesh data at runtime.
It’s real advice. It’s usually correct. And in this project it’s easy to act on: 238 models had Read/Write left on. So we turned it off on every one of them, rebuilt the standalone player, and took a fresh snapshot.
Mesh memory went from 1.19 GB to… 1.19 GB. Barely a rounding difference.
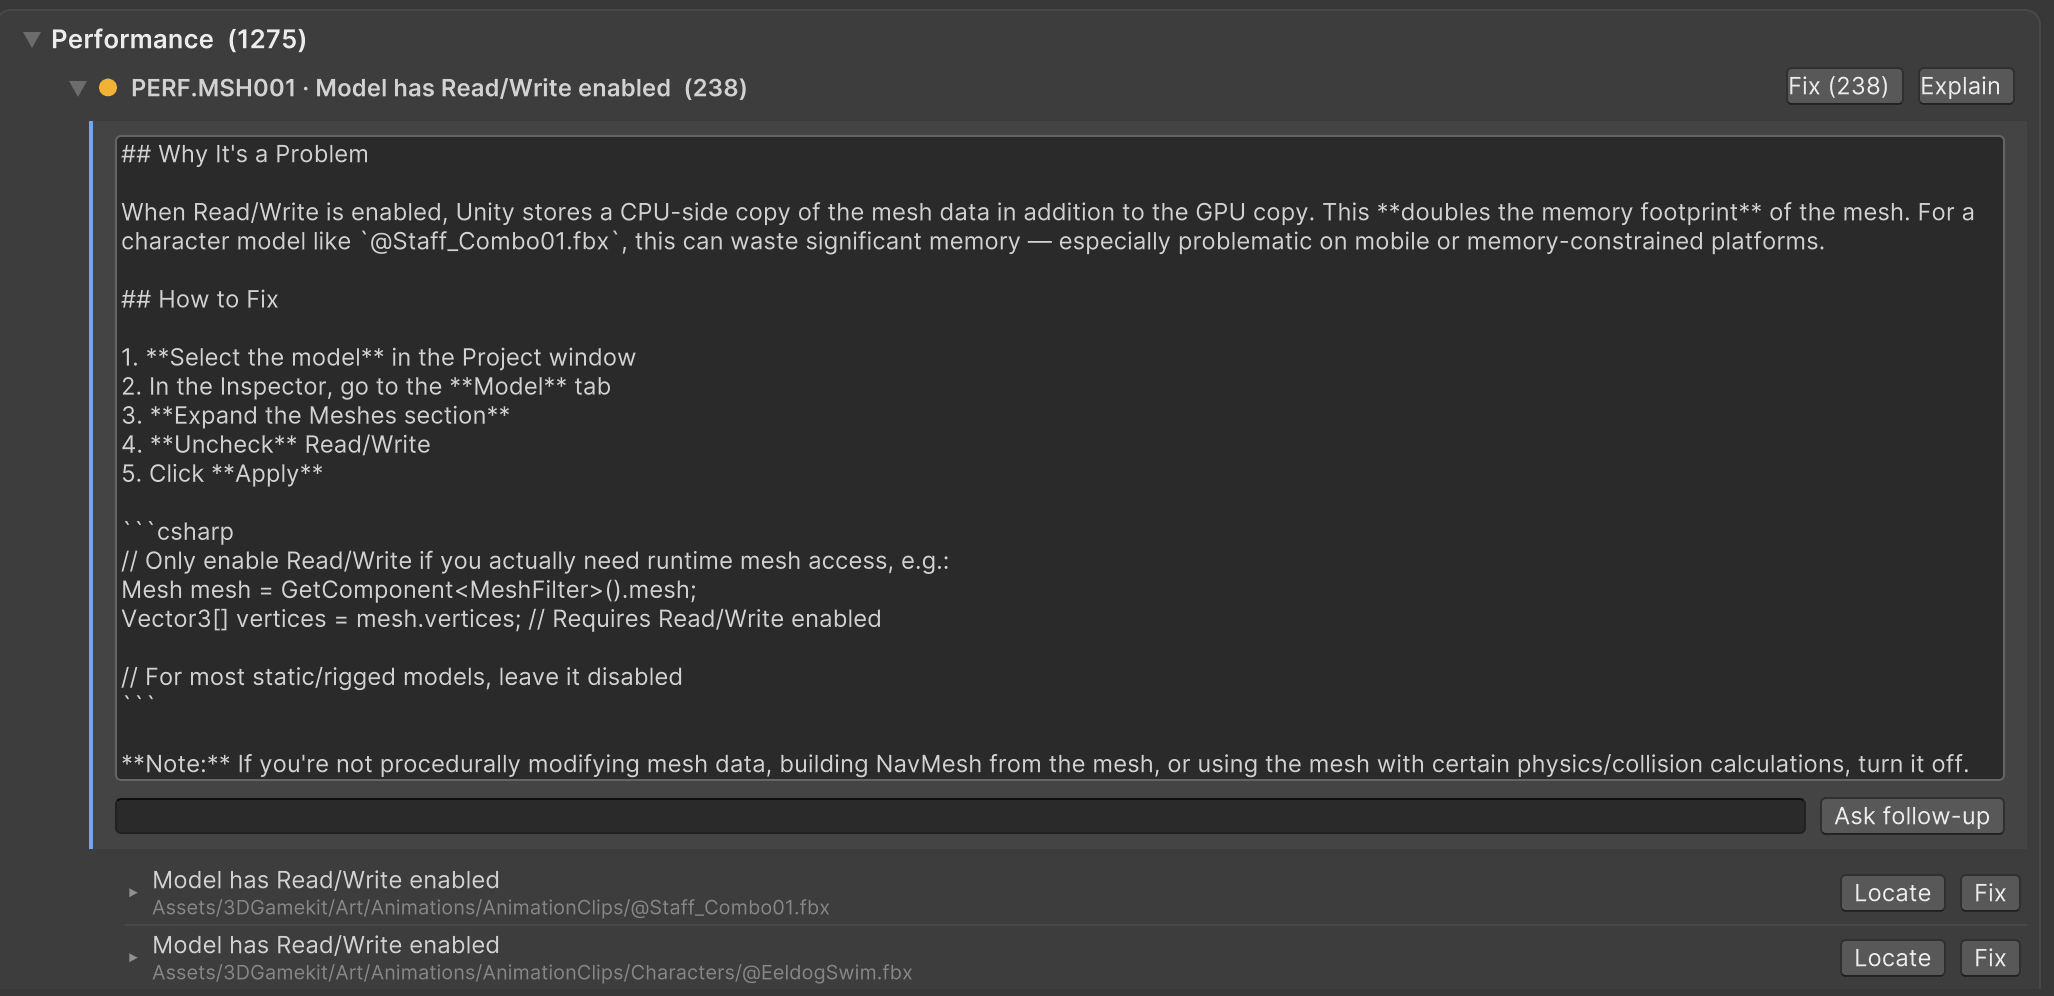
The confident answer didn’t hold. Not because it’s wrong in general — but because it has nothing to do with where this memory actually lives.
Where the memory actually lives
Expand the Mesh category instead of trusting the headline, and the real story is right there in the object names:
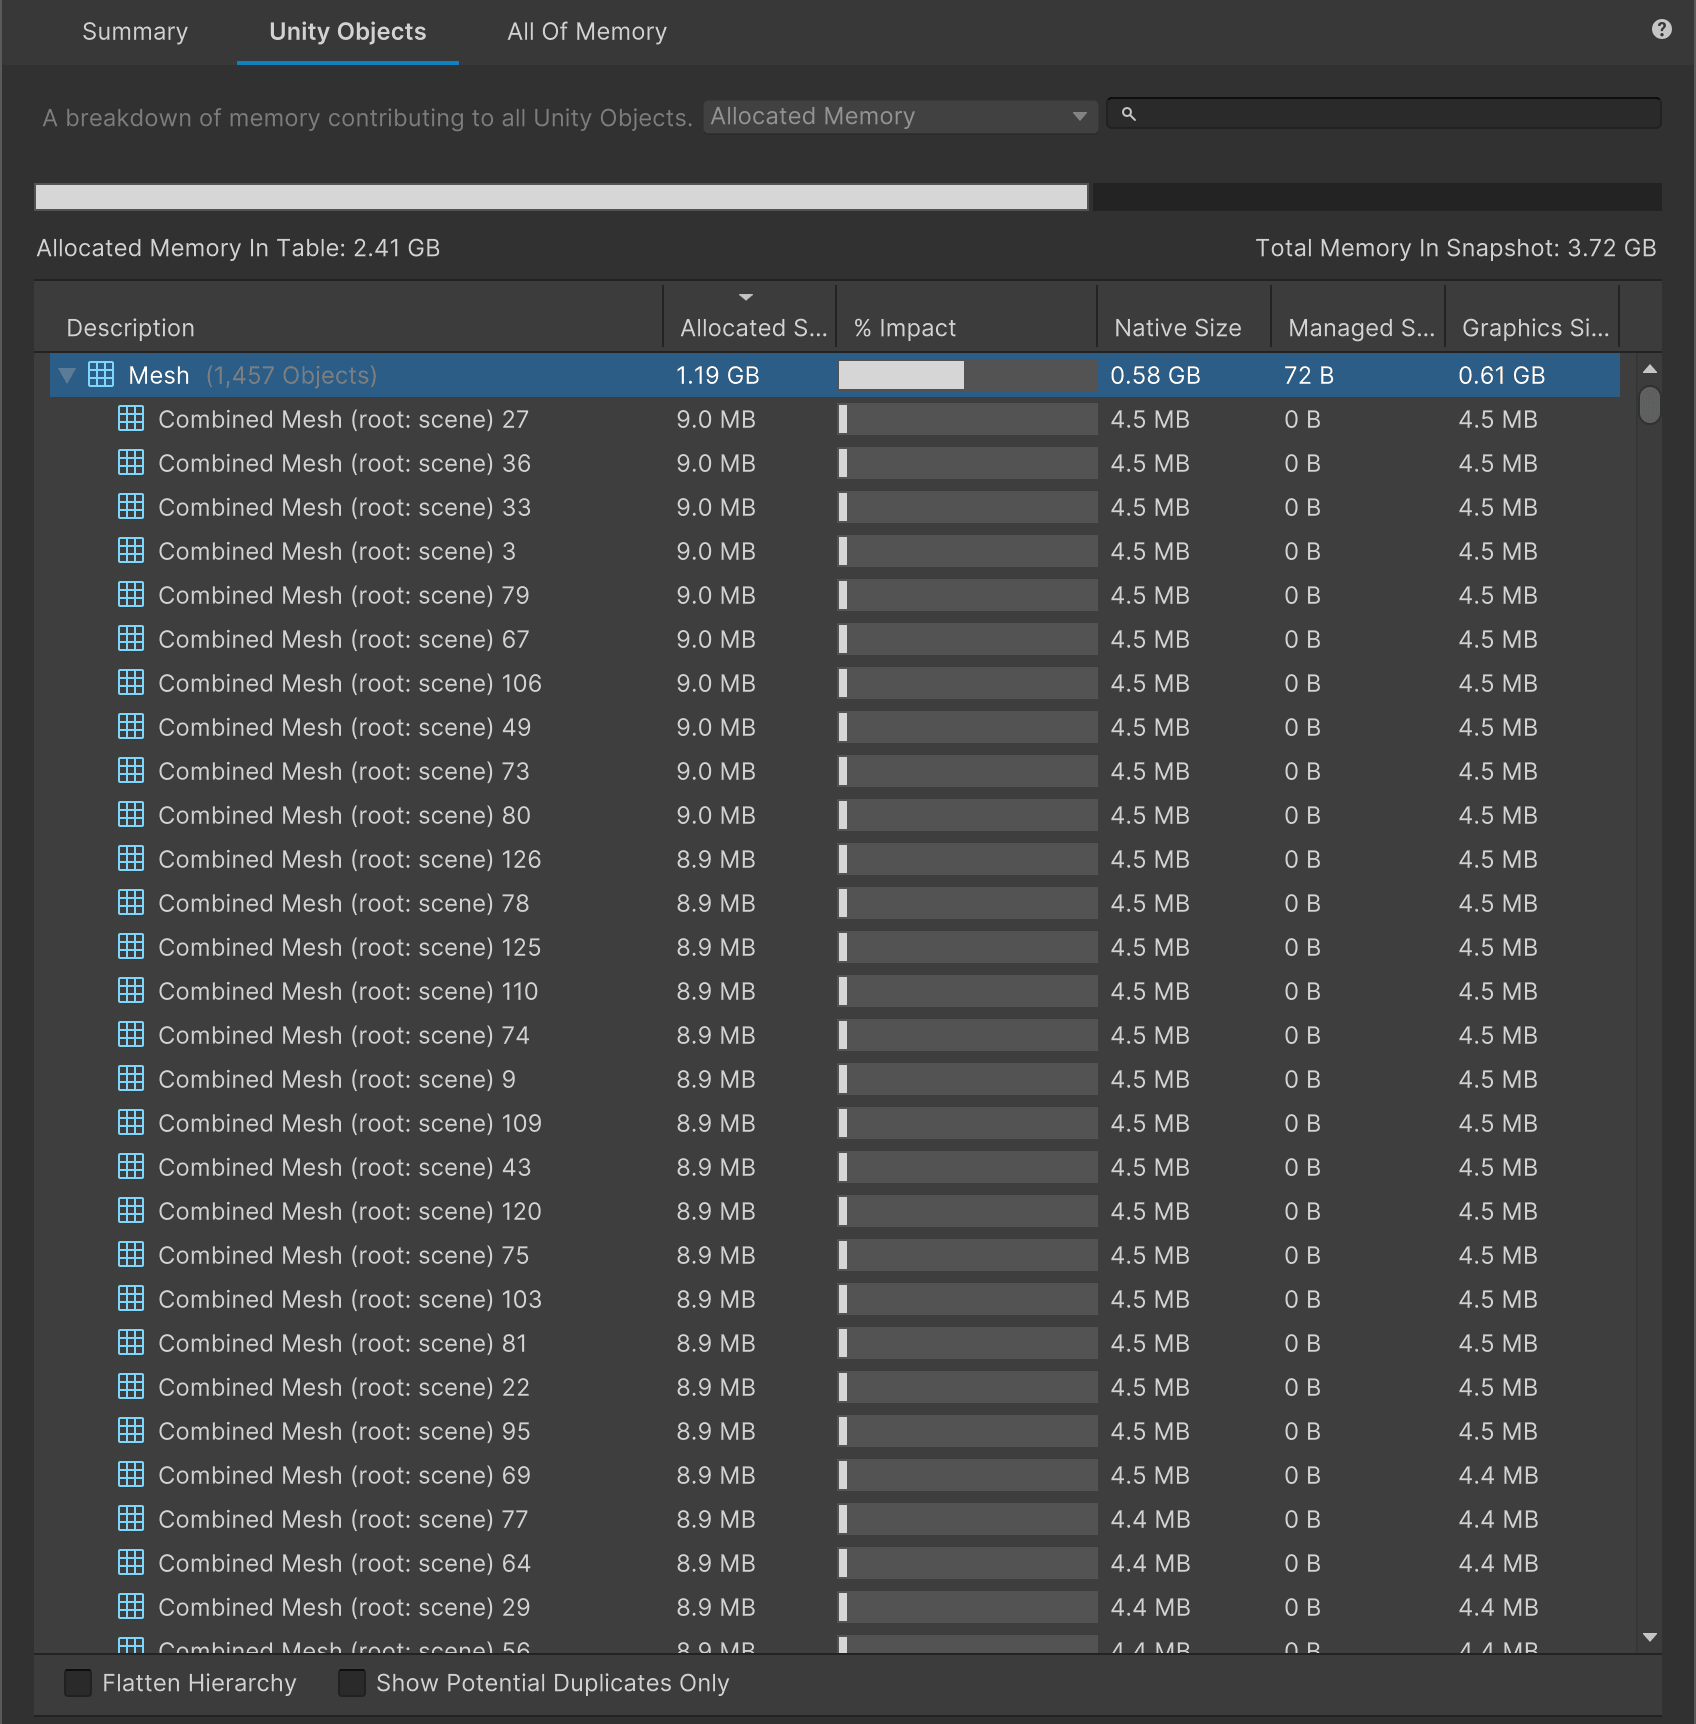
Row after row of Combined Mesh (root: scene N) — around 130 of them, ~9 MB each
(4.5 MB Native + 4.5 MB Graphics). These aren’t your source .fbx meshes at all. They’re
built by Static Batching.
At build time, Static Batching takes every renderer flagged Batching Static and copies its world-space vertices and indices into a Combined Mesh — one copy per instance, on top of the original shared mesh. Place a rock 100 times and its geometry is duplicated 100 times into the combined data. That duplication is the gigabyte.
And it’s completely untouched by the Read/Write flag on the source models — the Combined
Meshes are generated independently at build time and keep their own CPU-side copy regardless.
(It didn’t help that a good chunk of those 238 flags were on animation-only .fbx files with
no meaningful geometry to begin with. The textbook fix was aimed at the wrong bucket twice
over.)
What the diagnosis looks like when it’s measured, not asserted
We pointed PerfLint — our local, deterministic Unity diagnostics tool — at Level1. One finding names the bill exactly:
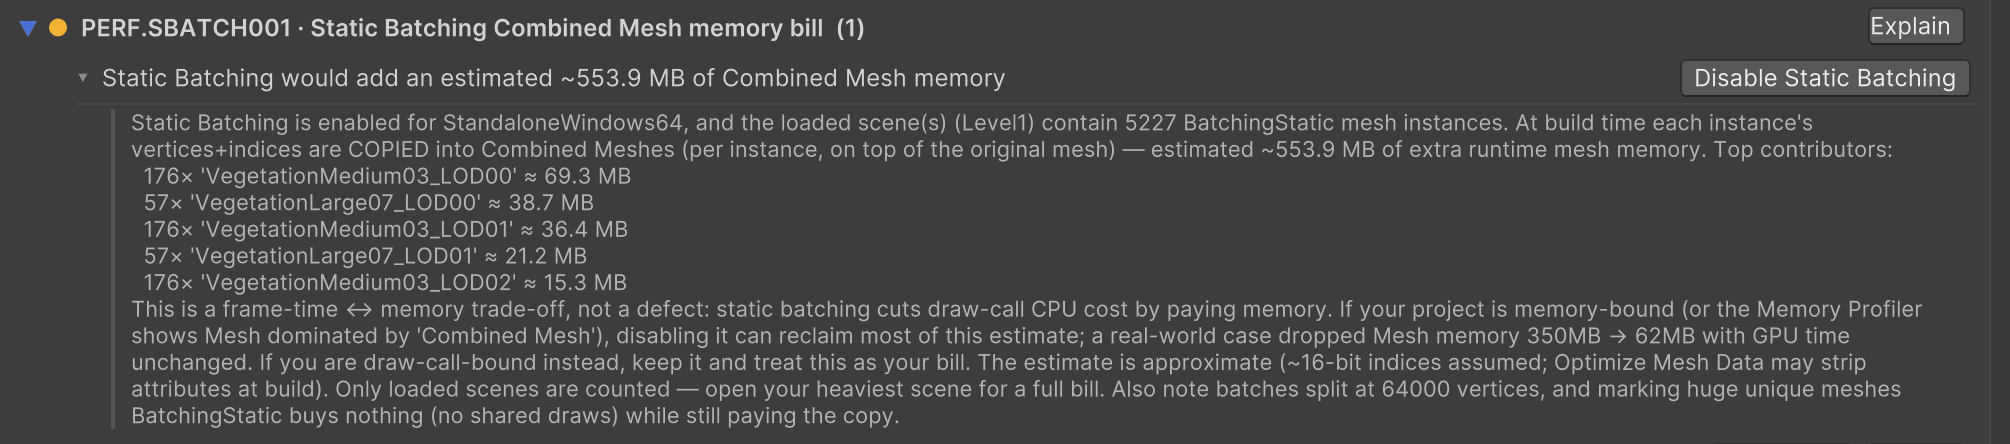
PERF.SBATCH001 — Static Batching would add an estimated ~553.9 MB of Combined Mesh memory. Static Batching is enabled for StandaloneWindows64, and Level1 contains 5,227 Batching Static mesh instances. Top contributors:
176× VegetationMedium03_LOD00 ≈ 69.3 MB,57× VegetationLarge07_LOD00 ≈ 38.7 MB,176× VegetationMedium03_LOD01 ≈ 36.4 MB…
The top of the list is vegetation — the same mesh placed 176 times, across three LOD levels, each placement copied into the combined data. Vegetation duplicated at this scale is the textbook case for GPU Instancing, not Static Batching. And a second finding shows the project already knows that:
MAT004 — GPU Instancing overlaps Static Batching. The vegetation materials already have GPU Instancing enabled — but Static Batching takes priority over instancing, so those renderers are drawn from the Combined Mesh and the instancing flag does nothing.
So this isn’t the usual memory-versus-draw-calls trade-off. The pieces to reclaim the memory and keep the draw calls low were already in place — Static Batching was just sitting on top of them.
(One practical note reproducing this: PerfLint’s Static Batching check reads the scene you have open, so it counts the instances in the scene actually loaded. Scan with your heaviest level open, not an empty menu scene, or the bill reads low.)
The switch, and the receipts
PerfLint surfaces SBATCH001 as a trade-off, not a one-click fix — it quantifies the bill and offers to disable Static Batching, but it makes you confirm, because turning it off can cost frame time if instancing can’t cover the draws. Here, MAT004 said it could. So we flipped it and rebuilt:
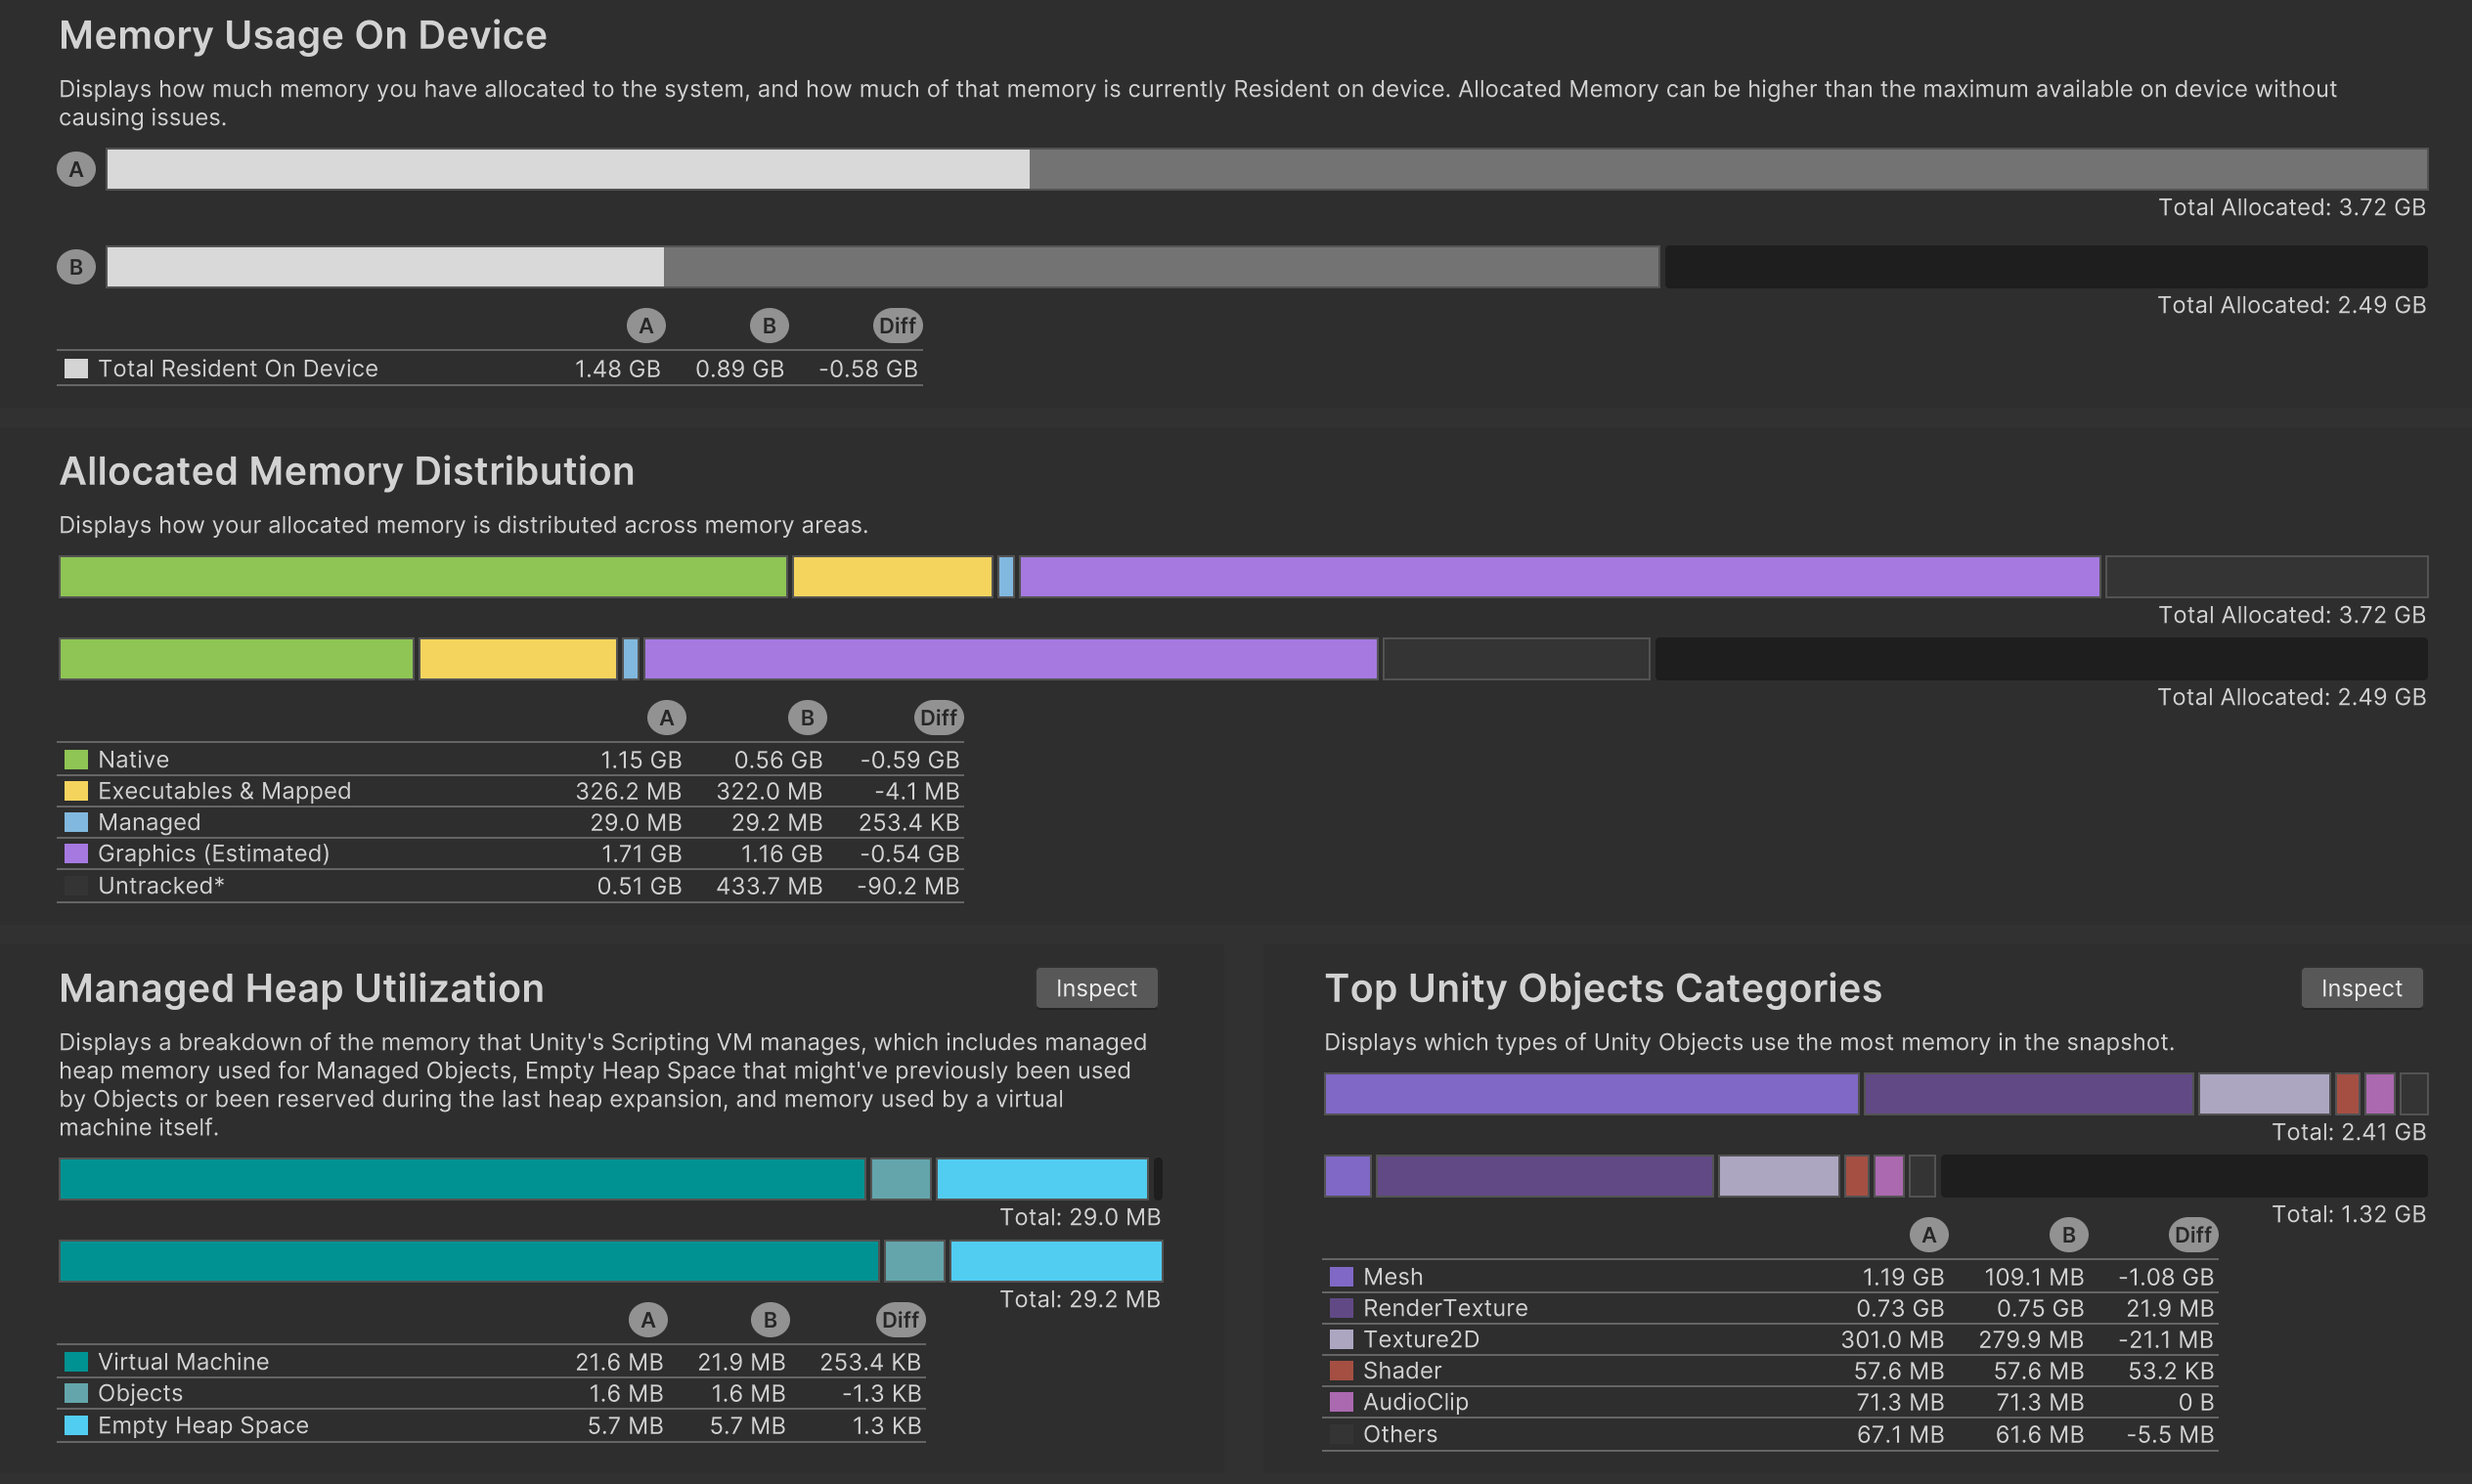
| Before | After | Change | |
|---|---|---|---|
| Total Allocated | 3.72 GB | 2.49 GB | −1.23 GB (−33%) |
| Total Resident | 1.48 GB | 0.89 GB | −40% |
| Mesh | 1.19 GB | 109 MB | −91% |
| Native | 1.15 GB | 0.56 GB | −0.59 GB |
| Graphics (est.) | 1.71 GB | 1.16 GB | −0.55 GB |
The Combined Meshes are gone; the vegetation now renders through the GPU Instancing that was already enabled on its materials. And the part you have to check to call this a win — the frame time — held. We measured it the same way as the memory: with the Unity Profiler connected to the standalone Development Build — not the Editor’s Game-view Stats overlay, which reports editor overhead, not your player.
The honest read: raw draw calls ticked up slightly, 646 → 696, as some of what Static Batching used to merge came back as individual draws. But the metric that actually costs didn’t follow — SetPass calls barely moved, 425 → 433 — GPU Instancing kept carrying its ~1,000 batched draws, and CPU frame time stayed in the same ~4 ms band. The same panel even corroborates the memory win from the other side: Used Buffers dropped from 0.61 GB to 76.8 MB as the Combined Meshes’ vertex and index data left GPU memory.
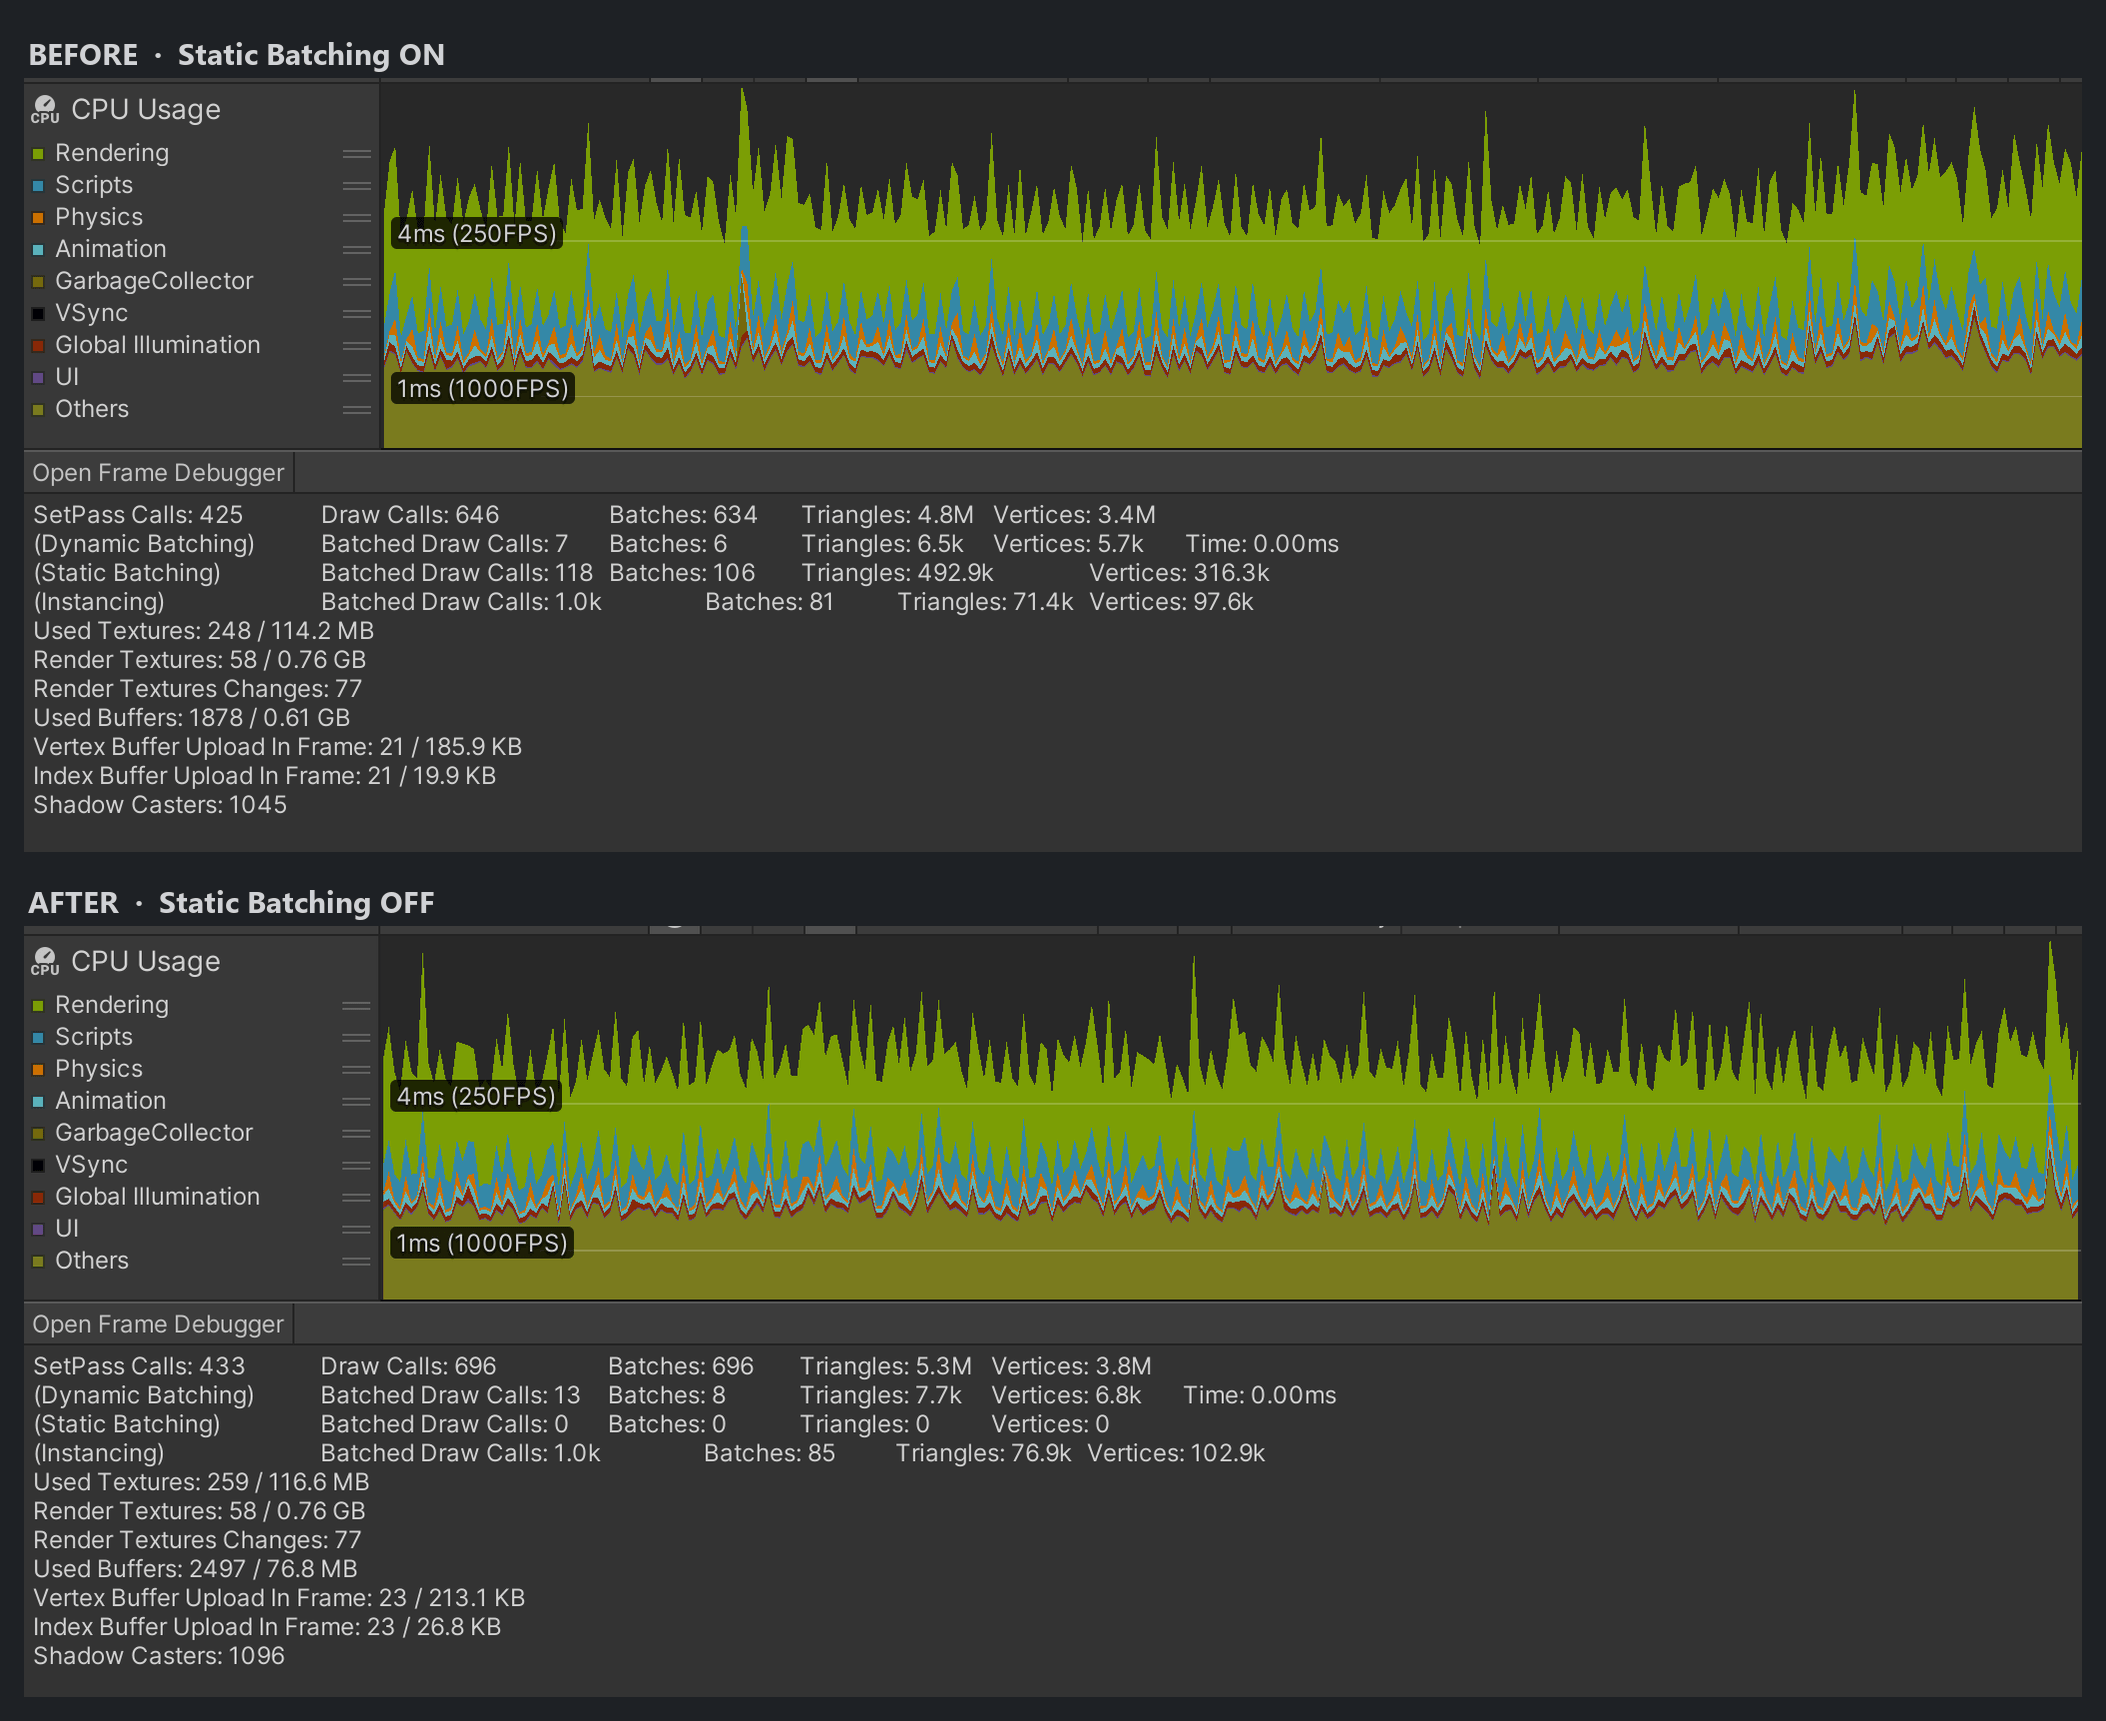
One switch. 1.23 GB of total memory and a 40% cut to resident, with no frame-time regression — the handful of extra draw calls were cheap, because instancing caught the static-batched draws instead of letting them fall on the floor.
(A footnote on honesty: SBATCH001 estimated ~554 MB, and the Mesh category actually dropped ~1.08 GB — roughly double. The estimate counts one copy, the CPU-side vertex+index bytes; the Combined Meshes also carry an equal GPU copy the estimate doesn’t. It under-promised, which is the safe direction, but we’d rather tell you why than let the numbers look magic.)
The build shrank too — by something the report won’t itemize
Static Batching isn’t only a runtime cost. The Combined Meshes are baked into the player, so the same switch cut the Complete build size from 2.1 GB to 1.5 GB — roughly 600 MB off what ships. But how it shows up is the interesting part. Here is Unity’s own Build Report for both builds:
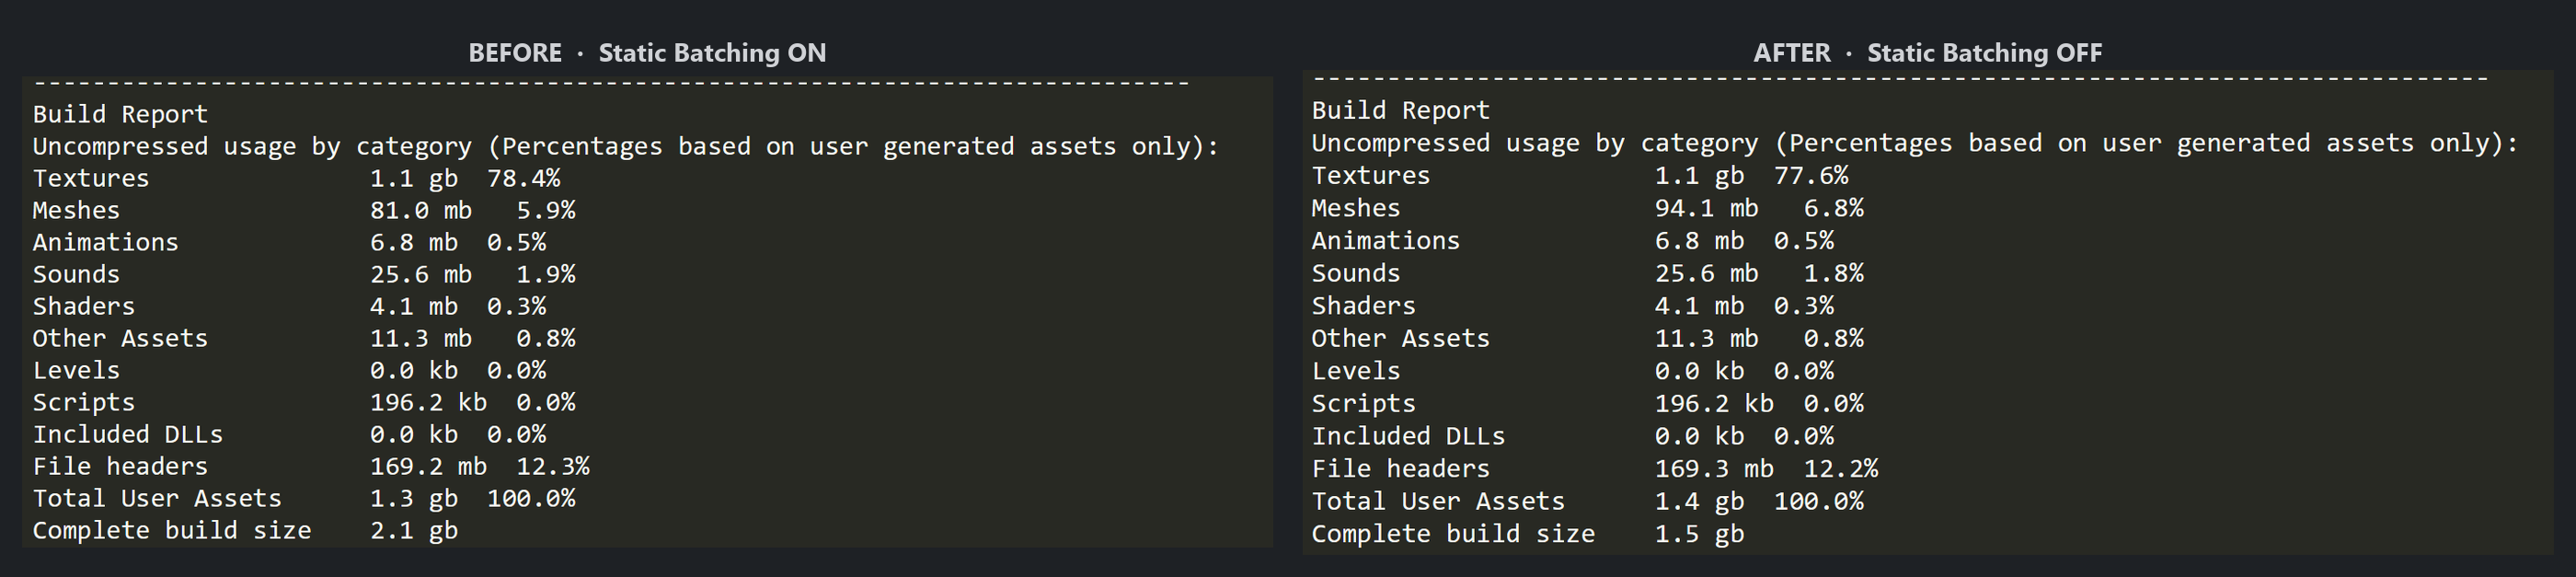
Every itemized category is nearly identical. Meshes reads 81 MB with batching on, 94 MB with it off — barely a wobble, and if anything it moves the wrong way. Textures, sounds, shaders, animations: unchanged. Total User Assets: ~1.3–1.4 GB either way. The only line that moves is the last one — Complete build size, 2.1 GB → 1.5 GB.
The reason is in the report’s own header: “Percentages based on user generated assets only.” The category breakdown itemizes your source assets. The Static Batching Combined Meshes are generated by the build, not authored by you — so they never appear under Meshes, or any category. They live in the gap between Total User Assets and Complete build size, which balloons from ~0.1 GB with batching off to ~0.8 GB with it on. That ~700 MB is the combined geometry, itemized nowhere.
So a developer auditing build size the obvious way — reading the category list — sees “Meshes: 94 MB, 6.8%” and moves on. The 700 MB never shows up next to the meshes it came from. In the Memory Profiler the combined data at least labels itself “Combined Mesh”; in the build’s own report it’s folded silently into the total. A plausible-looking audit, and a whole category of cost it can’t see.
The mirror image
If this interaction sounds familiar, it’s the same pair of systems we wrote about in What Unity’s AI Assistant Actually Changes When You Ask It to ‘Optimize This Scene’ — seen from the opposite switch position.
There, on Viking Village (URP), Unity’s AI Assistant confidently “verified” that Static Batching and GPU Instancing would interoperate — while Static Batching was switched off in that project. PerfLint’s MAT004 rule stayed silent there, because it read the toggle, saw it was off, and knew the premise didn’t hold.
Here, on 3D Game Kit, Static Batching was on and preempting instancing — so MAT004 fired, and SBATCH001 put a number on it. Same two systems, opposite states, and the tool gave the correct — opposite — answer each time, because each answer came from reading the project’s actual settings rather than from a plausible-sounding sentence.
Waste versus trade-off, again
The Read/Write advice failing here isn’t an argument against Read/Write. It’s an argument for one habit: before you act on a confident claim about memory, measure whether it touches the memory you actually have. In this project the meshes weren’t holding a CPU duplicate you could drop — they were holding build-time Combined Meshes, and the lever was three menus away from where the textbook pointed.
That’s the line PerfLint is built on:
- Waste — a duplicate you can always drop — gets a one-click fix.
- Trade-offs — Static Batching, shadow distance, texture caps, instancing versus the SRP Batcher — get a finding that quantifies the cost and stops. SBATCH001 will tell you Static Batching is trading frame time for memory, put ~554 MB on it, and never flip the switch for you.
We flipped it here because we measured that the trade came out clean on this scene — the memory dropped with no frame-time cost. On yours it might not — and the only way to know is to look, not to assume. Everything above is reproducible on the free 3D Game Kit sample, entirely on your own machine: the scan runs locally and uploads nothing.
PerfLint for Unity scans your project locally — performance, assets, and migration — with zero uploads and zero telemetry. Waste is one-click; trade-offs are yours. See how it works.
Rule reference: PERF.MSH001 · PERF.SBATCH001