An AI Agent Told Me Textures Were My Problem. Then It Called a Real Scanner and Took It Back.
A few weeks ago we audited Unity’s own AI assistant on the
Viking Village sample: it reported 367 actions across 157 files and called the project “completely
optimized,” and the git diff showed it had quietly turned quality dials down and asserted an
interaction between two features that are mutually exclusive by design.
The obvious follow-up question is whether that’s a Unity AI problem or an LLM-doing-this-task problem. So we ran the experiment on ourselves — same sample project, a general-purpose coding agent, and full access to the file system. Then we gave the same agent a deterministic scanner to call and asked the identical question again.
Round one: no tools, total confidence
The agent had the project open and could read anything on disk. Asked what to optimize, it spent
about three minutes reading .meta files and produced a genuinely impressive-looking report — a
priority table, P0 through P2, every row with a measured-sounding number:
- “130+ textures with
maxTextureSize: 8192”, including four source files of 130–227 MB each. A single 8192 DXT texture is ≈21 MB of VRAM, so “a batch of these eats several hundred MB — this is the main cause of frame drops and VRAM exhaustion.” - “113 textures with
isReadable: 1” — each keeping a second copy in CPU memory, “doubling memory; 99% of textures don’t need it.” - “Total texture sources: 236 files = 1.72 GB. This is the absolute bulk of the project’s size and memory.”
- And the headline recommendation: drop 8192 → 2048 and turn off Read/Write, and “runtime texture memory typically drops 50–70%, while tiled architectural and wood textures are nearly indistinguishable to the eye. This is the highest value-for-effort step.”
Read that as a developer and you’d start clicking. It’s specific, it’s quantified, it cites real fields from real files.
It’s also wrong in four separate ways.
The 113 “textures” with Read/Write are mostly meshes. 95 of them are FBX models with Read/Write enabled — a real and worth-fixing issue, but a different asset type with a different fix and a different memory profile. The agent pattern-matched a serialized field across file types and collapsed two findings into one wrong sentence.
The 1.72 GB is on-disk source art, not memory. Those are .tif and .psd authoring files.
What ships and what loads is the imported result, which is governed by the platform’s max size and
compression settings — numbers that live somewhere else entirely. Confusing source-file bytes with
runtime VRAM is the kind of error that produces a number too big to ignore and too wrong to act on.
The premise of the headline fix didn’t hold. Most of those textures were already capped at 2048 by their platform override. The “8192” the agent found is the ceiling on the default settings block, not what the build actually produces. Dropping a ceiling that isn’t binding changes nothing.
And “50–70% for free” is a trade-off sold as waste. Reducing texture resolution buys performance by spending image quality. Maybe that’s the right call for your game — but it is your call, and it is not free, and “nearly indistinguishable to the eye” is a judgment the person shipping the game gets to make about their own art. This is precisely the failure we’d documented in Unity’s assistant. Same category of mistake, different vendor, no vendor-specific explanation available.
To be fair to the agent: the direction was reasonable. Textures usually are the bulk of a project like this. It was reasoning sensibly from the only evidence it had. That’s the problem — the evidence available to a file reader doesn’t determine what a Unity project actually loads at runtime.
Connecting a tool that doesn’t guess
Unity’s newer CLI turns commands registered through its Pipeline package into tools any MCP client can call, and PerfLint registers its diagnosis as exactly those commands. One line points an agent at them:
unity mcp configure claude-code --project-path /path/to/YourProject(cursor, codex, copilot and a dozen others are supported. If you have more than one editor
open, pin the project path — otherwise the CLI can’t tell which editor you mean. And an agent session
that’s already running won’t see a newly-added server until you restart it, which cost us a
confusing ten minutes.)
Restart, and six PerfLint commands show up in the agent’s tool list alongside Unity’s own:
perflint_scan, perflint_list_findings, perflint_optimize_plan, perflint_optimize_apply,
perflint_fix, and perflint_gate.
Round two: the same question, the same agent
It called perflint_scan, then perflint_list_findings for the itemized rule breakdown. Health
score 39 out of 100, grade F, 337 findings across 24 rules, 204 of them one-click fixable.
Then it opened its answer by correcting itself. In its own words (translated from the session):
First, let me correct myself: textures are not the main problem. In round one I saw 1.72 GB of source textures and 130 files at 8192 and raised the alarm — running the scan shows that was mostly a false alarm. Those
.tifsources are huge on disk, but the import settings are reasonable: the platform cap is 2048 and most are already DXT compressed. PerfLint reports one oversized texture and twenty uncompressed ones. The real bulk is meshes, not textures.
We did not prompt it to re-examine its earlier answer. It called a tool that reports what a rule actually matched, saw the discrepancy, and withdrew a confident claim it had made ten minutes earlier. That’s the entire argument for a deterministic layer, demonstrated by the model itself: an LLM cannot audit its own plausible-sounding output, but it can read a measurement.
The itemized numbers it got back are unglamorous, and that’s the point. One genuinely oversized texture — an 8192×4096 HDR skybox, which is a legitimate thing to flag. Twenty uncompressed textures. 95 models with Read/Write left on. Six audio clips still uncompressed PCM. Two byte-identical copies of the same normal map. A material with a missing shader that renders magenta. A rule fires when a real condition is met, or it stays quiet — so on a well-imported sample project, the honest reclaimable total is far smaller than “hundreds of MB.” Any tool that returns a big number here is telling you a story.
Then we ran it again with a different vendor’s agent
One agent retracting one claim is an anecdote. So we repeated the whole thing with OpenAI’s Codex
(GPT-5.6) against the same editor — different model family, different company, same unity mcp path.
It called the same tools and produced the same verified picture: 39/F, 337 findings, 204 auto-fixable,
and — reading the paged item list — the specific offenders by name: the 8K skybox, the magenta
material, the duplicate normal map pair, the deprecated API call at Water.cs:22. It sorted
everything into a P0–P3 matrix, more thoroughly than the first agent had. No invented memory figures.
It also declined to apply anything, on the correct grounds that the working tree had uncommitted
changes.
Both agents, independently, also did something we didn’t build: they separated the safe fixes from the judgment calls in their own summaries, and handed the judgment calls back. When the ground truth arrives with the cost of each change attached, the agent tends to relay that structure rather than flatten it.
The write side, and why the tool doesn’t take the agent’s word for it
Then we let an agent actually apply things. It ran a dry run first, confirmed the scope, and applied
the deterministic batch: 204 fixes, zero failures, grade F → D on its own reading, all of it
import-settings changes — recoverable from the commit we made first, not from Edit > Undo, which
Unity does not record importer writes into.
Afterwards we re-scanned independently, from a separate shell, to check its report. The tool came back with a different number: 63/100, grade C — better than the agent had claimed, because the agent measured while a domain reload from its own last change was still in flight.
We consider that the healthiest moment in the whole session. The verification layer didn’t rubber-stamp the executor’s self-report; it produced an independently derived figure that happened to disagree. If your workflow is “agent does the work, agent grades the work,” you have no such moment.
Where the guardrails ran out
An honest note, because this is the part that matters if you’re going to hand an agent write access.
PerfLint’s design line is fixed: waste is automatable; trade-offs are yours. Over the wire, the apply command only touches the safe, reversible tier. Trade-offs — disabling Static Batching, enabling Mipmap Streaming — come back described with their cost and are left for you in the editor. Irreversible operations, like merging duplicate assets (which deletes files), are never executed over the wire no matter what the agent asks; they’re reported and pointed back at the editor, where each one still shows its own confirmation. The tool enforces that in code, because “the agent promised to be careful” is not an enforcement mechanism.
What we can’t enforce is what the agent does outside our tools. Having finished the import fixes,
the first agent went and hand-edited a C# file on its own — swapping a deprecated
FindObjectOfType call for its modern replacement — asserting on the way that compilation would be
fine. It happened to be right, including a subtle detail: it chose the deterministic
FindFirstObjectByType over FindAnyObjectByType because the call site was a singleton lookup. The
edit also triggered a domain reload that knocked out its own MCP connection mid-session.
That’s a good outcome and a risky pattern. Give an agent hands and it will reach past the safe path into the place where verified-versus-plausible matters most and no guardrail exists. It’s why PerfLint’s own code-level migration writes the change, compiles, and rolls back automatically on failure — and it’s why exposing that verified path over the wire is now on our list, so an agent’s code edits can go through a mechanism that checks itself instead of an assertion that it’ll be fine.
The harder case: a project that doesn’t compile
Everything above happened on a project that at least built. The more interesting case is the one where nothing runs — because that’s where an agent reading files has the least to go on, and a deterministic scanner has the most.
So we reset the same sample to its pristine state and opened it in Unity 6 without fixing anything first. It doesn’t compile. The water renders magenta. PerfLint scores it 0 out of 100.
Asked what to optimize, the agent scanned and opened by correcting the headline number we’d just handed it:
But the grade is misleading: nothing here is a frame-time problem yet. The score is pinned at 0 by correctness breakage from the Viking Village / Boat Attack upgrade. Fix that first — perf tuning on a project that doesn’t compile is wasted work.
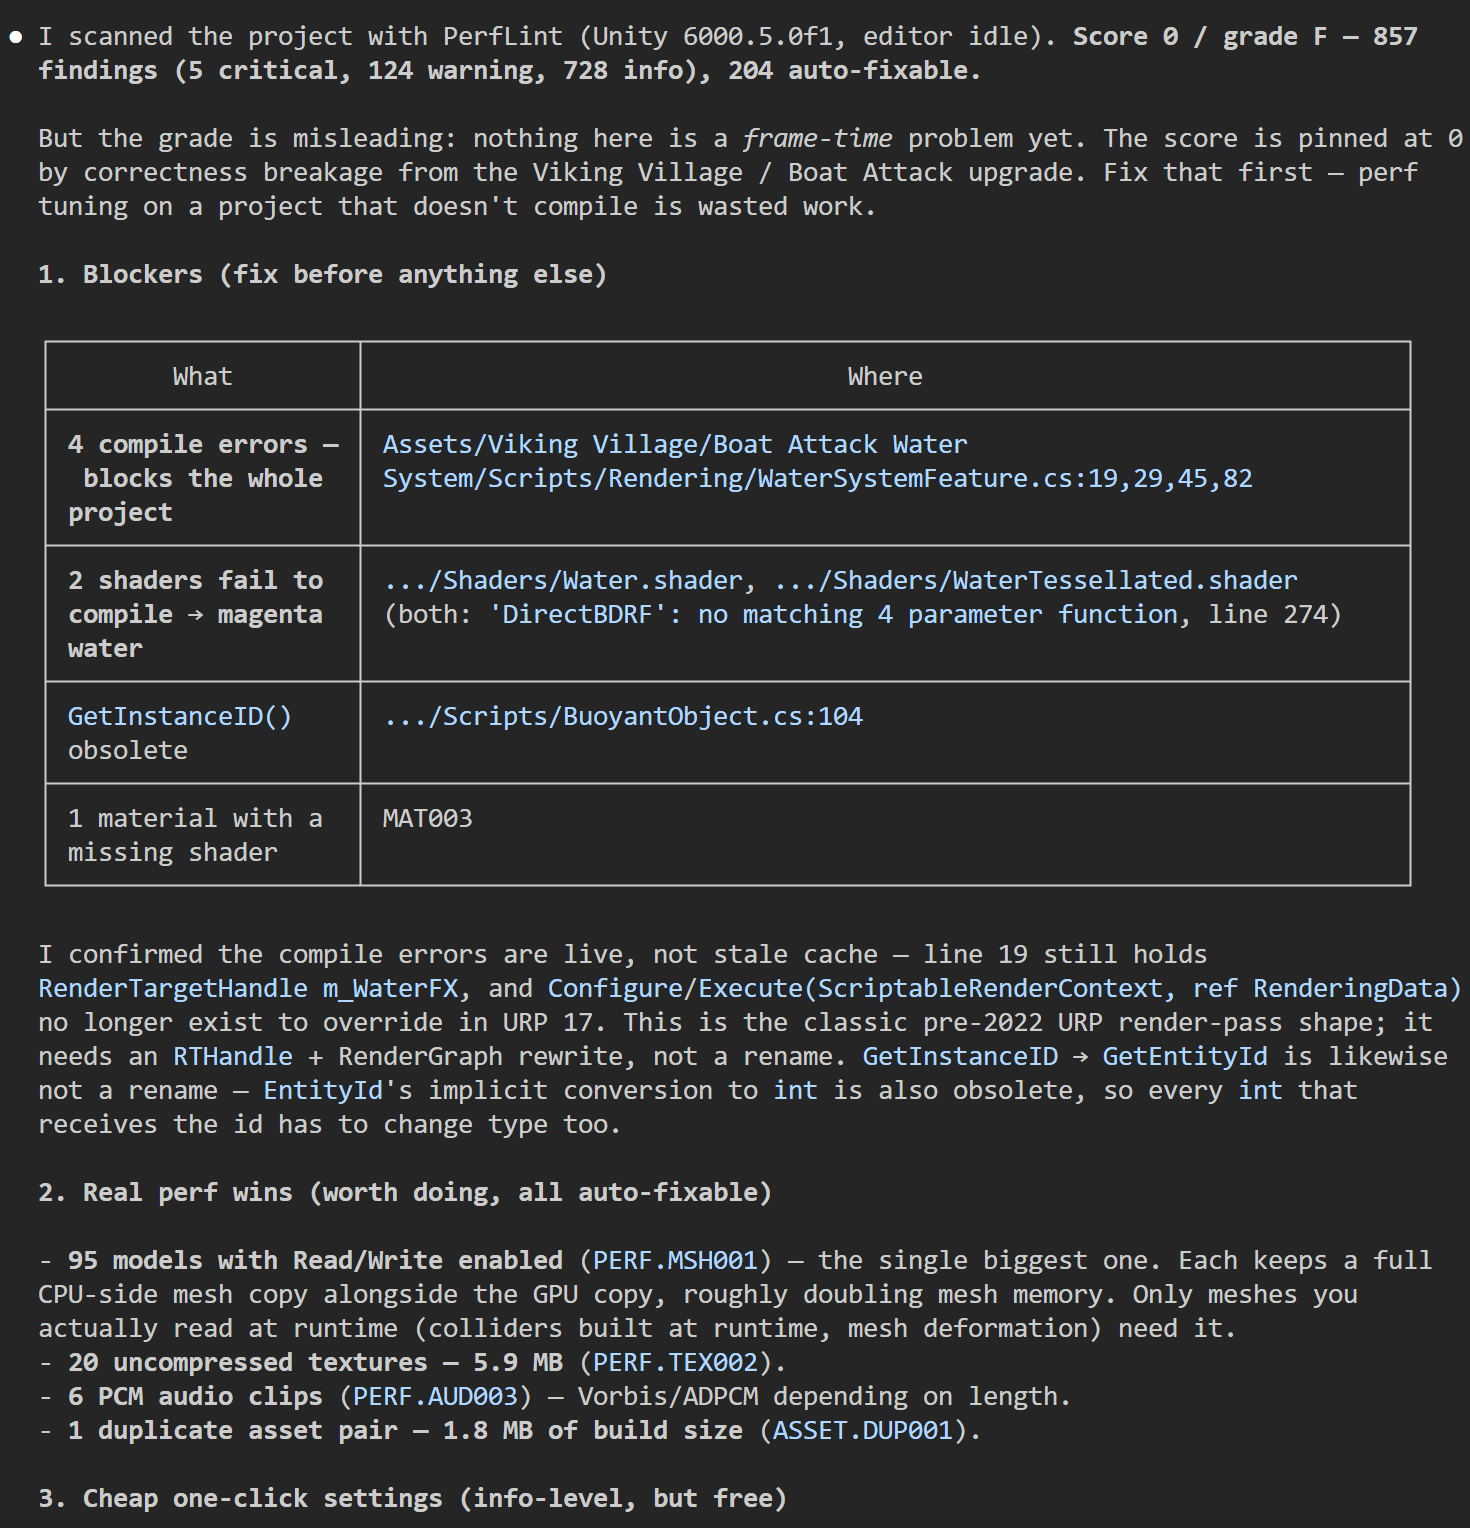
Then the five blockers with exact lines, and a check we didn’t ask for: it confirmed the compile errors
were live rather than a stale cache, by verifying line 19 still held RenderTargetHandle m_WaterFX.
And it declined the biggest number on the board. Of the 857 findings, 567 are “asset may not be referenced by the build” — two-thirds of the total, and exactly the kind of figure that makes a tool look impressive in a screenshot. The agent read why they fired:
Only
SampleSceneis in build settings, so nearly the whole Viking Village library reads as unreferenced. Ignore until your build scene list is real.
The part the agent couldn’t do
The five blockers are code changes, and none of PerfLint’s six commands touch code. Our own migration path writes the file, compiles it, and rolls back automatically if the build breaks — but that runs in the editor, behind a button. So this half of the job meant leaving the conversation, clicking three times, and coming back: score 0 → 42, criticals cleared, water restored.
That gap is ours, and we’d rather name it than design around it. The one mechanism we built to make AI code edits safe is the one thing an agent can’t reach yet.
The check a button can’t do
Back in the conversation, one sentence — “Apply the safe fixes with PerfLint.” The agent re-scanned to confirm where things stood, and then stopped before touching anything:

That is a precondition, verified. The editor’s Fix All applies the identical 204 changes and is quicker
to click — but a button can’t read your code. It turns Read/Write off on 95 models because Read/Write is
usually waste, and if one of your scripts happened to read mesh.vertices at runtime you’d find out when
something broke. The agent searched first, found the single hit was a procedural mesh being written
rather than an imported one being read, and said so before applying.

Then, from a separate shell, we asked the tool again rather than taking the agent’s word for it:
$ unity command perflint_scan
{ "score": 63, "grade": "C", "findings": 649, "critical": 0, "warning": 4, "autoFixable": 0 }
Same numbers. Nothing left to one-click — the editor’s Fix All button is greyed out:
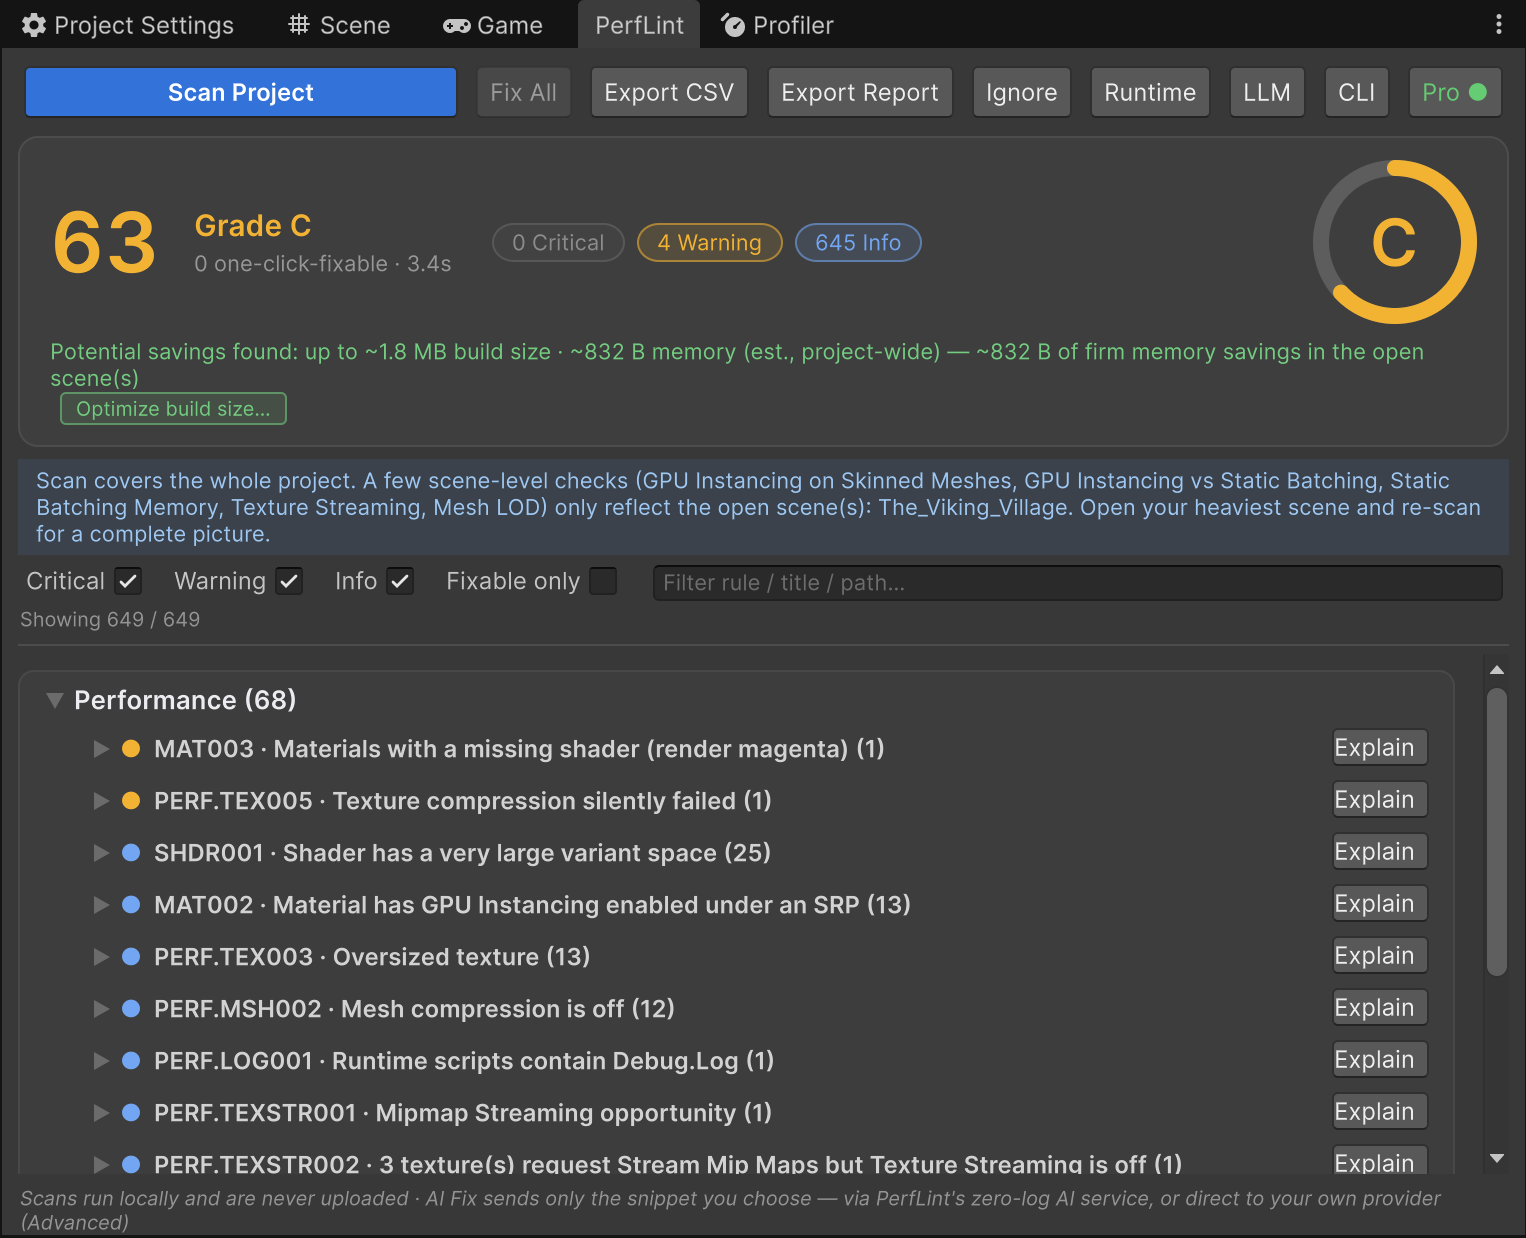
0 → 42 → 63, F to C, in about four minutes of agent time and three button clicks.
One caution the run earned honestly: by the end, three different things had edited this project — PerfLint’s migration, the agent, and Unity’s own API Updater, which asked once about a file we were fixing and then quietly rewrote two others nobody had mentioned. Afterwards there is no way to tell from the working tree who did what. Commit before you start.
What we’d actually conclude from this
One project, one sample scene, two agents. Not a benchmark. But the pattern was identical across two model families, and it’s the same pattern we found in Unity’s own assistant:
- Agents are good at navigating, explaining, sequencing, and relaying — genuinely good, and better than a human at the tedious parts.
- Agents are unreliable at deciding what’s true about a project’s actual runtime cost from file-level evidence, and they cannot tell their own plausible output from their own verified output.
- Give them a tool that returns measurements with costs attached, and the failure mode largely disappears — including, in our case, retroactively.
- And then they do something the tool can’t: our own button applies 204 fixes on the assumption that nothing reads mesh data at runtime. The agent went and checked that assumption against the code before letting it run. That is the part worth paying attention to — not that an agent can press a button, but that it can check the thing the button takes on faith.
Everything in PerfLint’s scan is deterministic and runs entirely on your machine; nothing is uploaded and detection spends zero tokens. One disclosure, since it’s a new data path and we’d rather state it than bury it: when an agent calls these commands, the findings it receives include asset paths and line numbers, and those go to whichever agent you connected — a cloud model, in most setups. The scan itself still uploads nothing, and every tool response says so explicitly.
The six commands ship in PerfLint v1.4.0. If you want to try the experiment yourself, the interesting version is the one we ran: ask your agent what to optimize before you connect the tools, save its answer, then connect them and ask again.
PerfLint for Unity scans your project locally — performance, assets, and migration — with zero uploads and zero telemetry. Waste is one-click; trade-offs are yours. See it run from an agent or watch the 80-second demo.